





Last week Andy Burnham announced a new commission to examine alternatives to the UK’s First Past the Post (FPTP) electoral system. The idea is to find a system which can better reflect the views of voters while not being overly onerous on voters and ensuring that voters are well represented. The exact requirements that the commission will prioritise remain unclear and no change would be brought in before the next general election.
There are a wide variety of different electoral systems used across the democratic world which the commission may consider so I’ve put together a simulator showing how some of the main options could look.
Some systems are very proportional whilst others are only a fraction more proportional than the current system which is remarkably non-proportional and was the least proportional that it has ever been in 2024. Below are the seat and vote shares for the major parties from the last general election.
2024 General Election: Seats vs Vote Share
Historically, FPTP has hurt the Lib Dems, UKIP/Reform and the Greens. This has nothing to do with ideology and instead has to do with relative strength and geography, Reform were polling sufficiently highly for much of 2025 that the system would have benefitted them at the expense of the Conservatives.
The most common measure of proportionality is the Gallagher index. The most recent Scottish parliament election had a Gallagher Index score of 13.7, the Senedd was 9.5, the NI Assembly was 8.2 and most European democracies have scores of under 10. The UK election of 2024 had a score of 23.2.
So what to replace it with?
There are a lot of potential options that are used elsewhere, some like the Alternative Vote (AV) and especially the Supplementary Vote (SV) are very similar to FPTP. Australia uses AV, some mayoral elections like Greater Manchester and London use SV. You end up with one representative per constituency and the results are not proportional.Others are true proportional systems.
List PR systems let voters pick a party (or a candidate from one party) and seats are awarded based on the proportion of votes that party received. The more seats available in the region the more proportional it is. Some countries exclude very small parties by imposing a minimum threshold, usually around 5%.
Mixed systems, like those in Scotland and Germany, combine FPTP constituencies with a compensatory list system which rectifies the disproportion from FPTP. The more seats a party wins in the constituency the fewer they win on the list. As with list-only systems, the bigger the list the more proportional the system.
And then there’s STV where voters rank candidates in order of preference and, after several rounds of counting, the most popular candidates win. This is used in Northern Ireland and Ireland. It manages to be very proportional despite giving out relatively few seats per constituency.
The Model

My new model includes a version of some of the main electoral systems in use in the democratic world today. I have examples which mimic the current Scottish, Welsh and NI systems as well as other nearby democracies like Germany, Spain, Belgium and the Netherlands.
It’s made from stacking together existing constituencies like Lego. AMS constituencies are about twice as big as Westminster ones, so I joined two together and added the other to the list. For STV all constituencies elect between 4 and 7 MPs which means combining 4-7 real world seats together.
Lists for AMS and List PR are much bigger and come with a few options you can pick. Some are small to mirror Scottish rules, others are huge. The Dutch system is a single nationwide list of all 650 seats. You can set a formal threshold of anywhere between 0 and 10%.
You can search for the name of your existing constituency to find where I assigned yours to. I tried to respect historic boundaries as much as I could but this wasn’t always feasible.
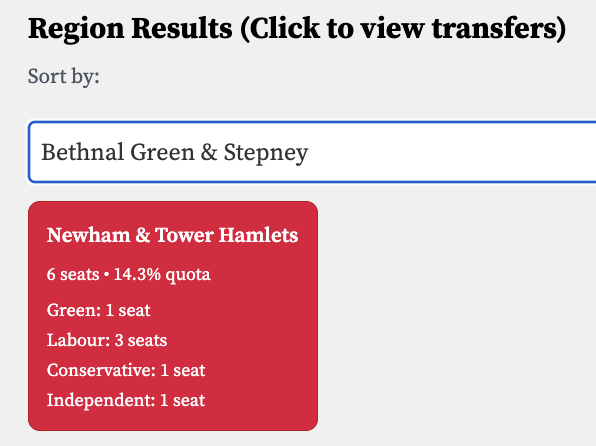
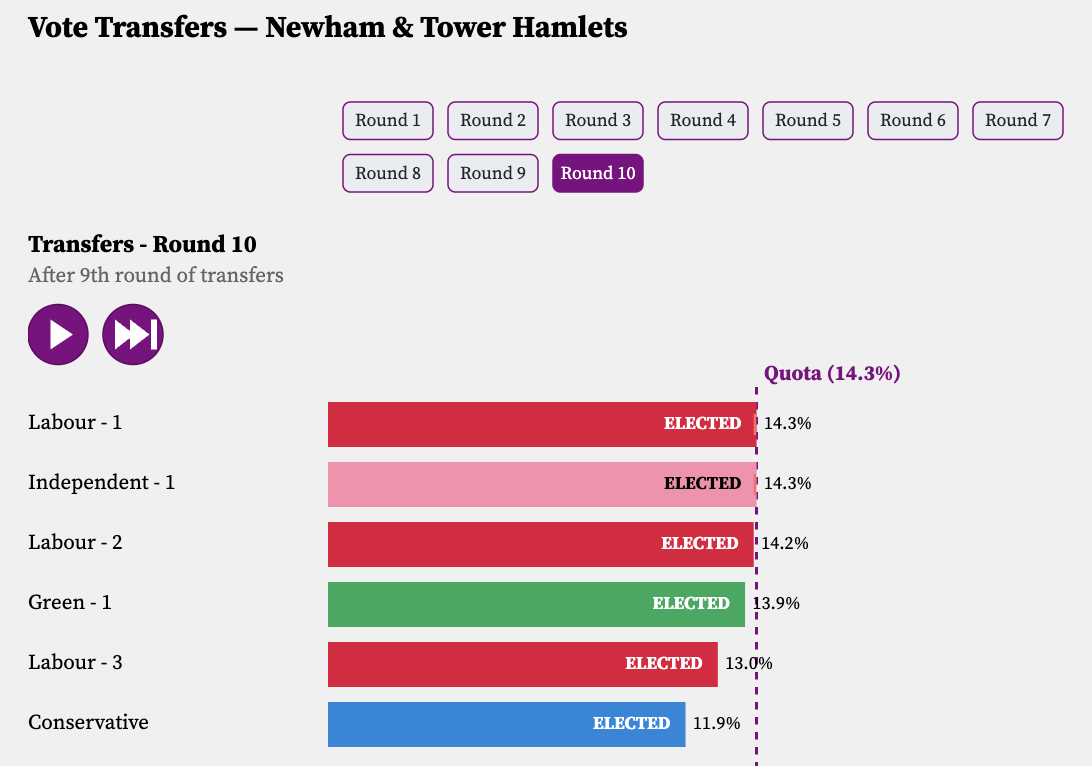
Bethnal Green & Stepney falls under Newham & Tower Hamlets under STV.
Every system comes with a Gallagher Index and a table comparing it with the other options. You can enter any set of numbers you like or break it down by country or region. If you want to see just London under AV, go for it. Want to see Scotland in a world where the SNP get 0 votes and uses Welsh style list PR? Do it.
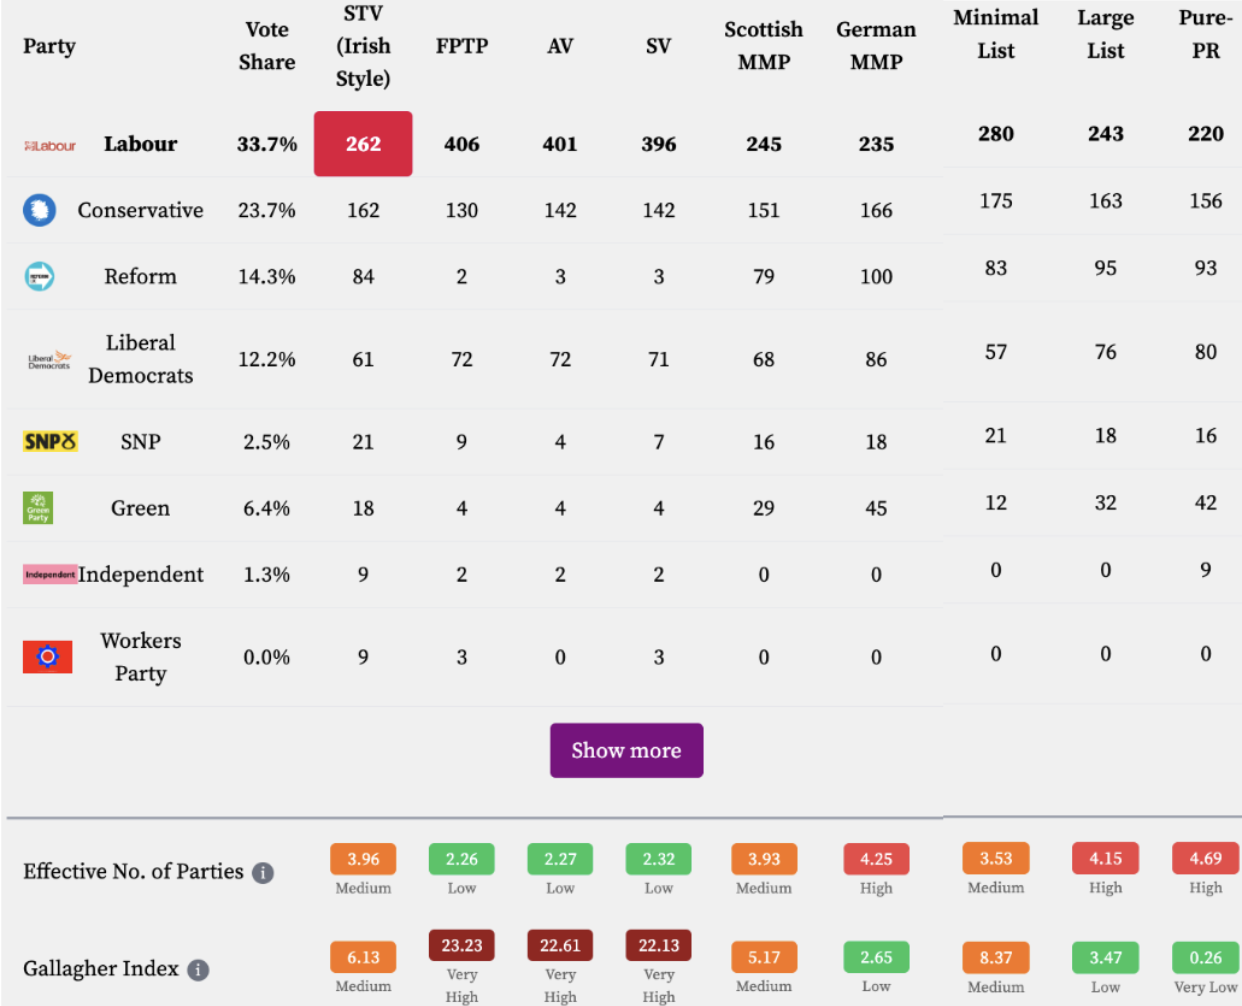 Real 2024 results under various systems
I’ve added some controls to dampen the effect of strategic voting by smoothing voting behaviour across neighbouring seats, and the ability to use any vote shares undercuts strategic voting too. But, it is primarily to give an idea of what could happen rather than what definitely would happen.
You can also try to cobble together a coalition under each scenario. Some systems, like AV, will lend themselves to majorities more easily than Dutch style PR.
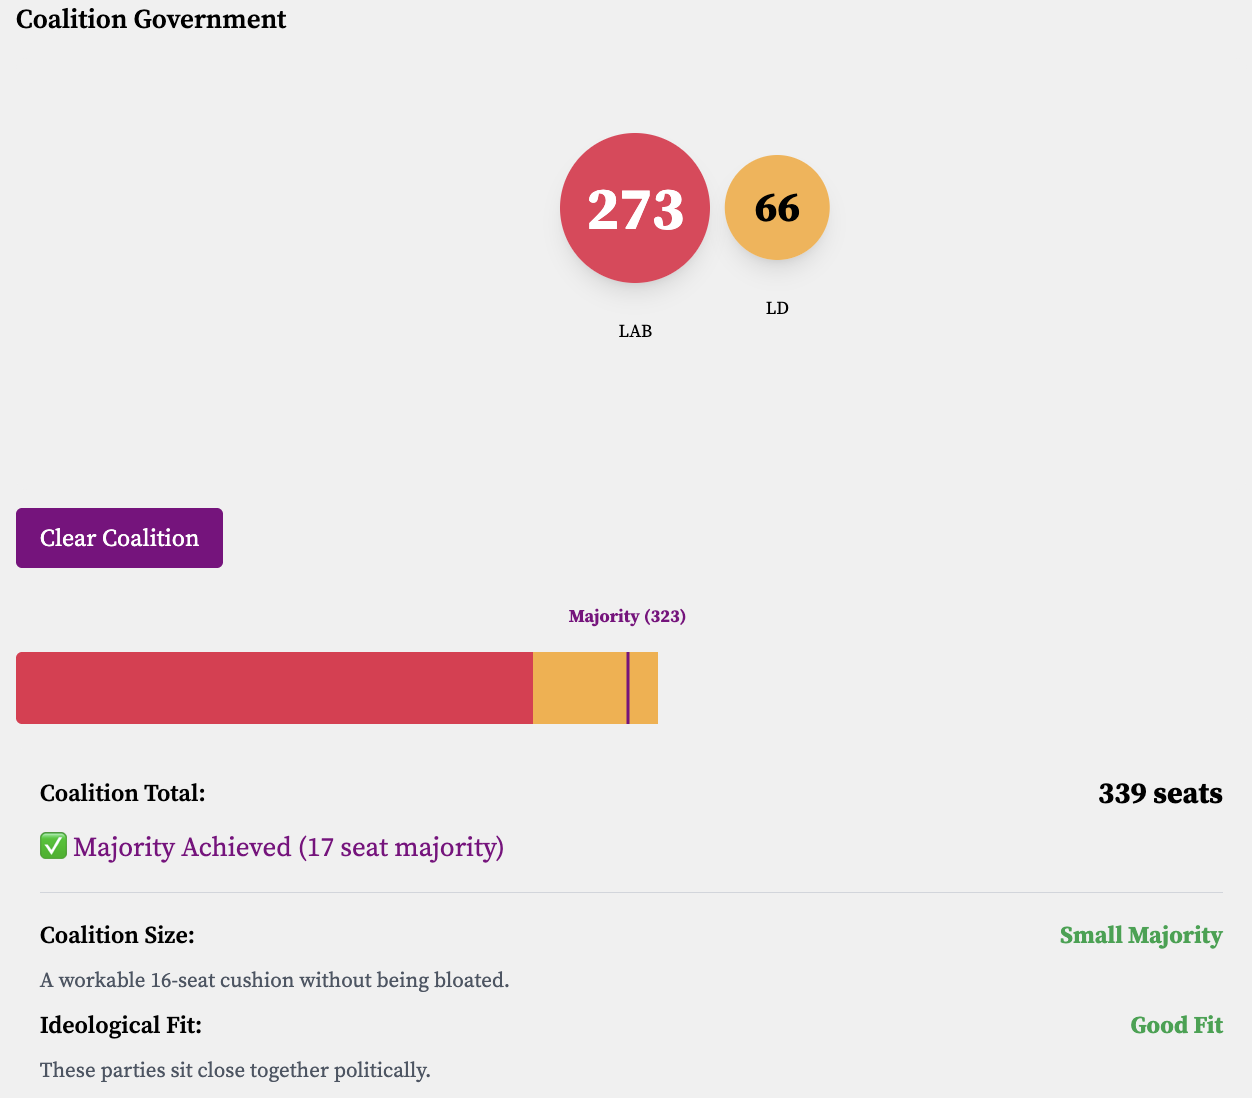
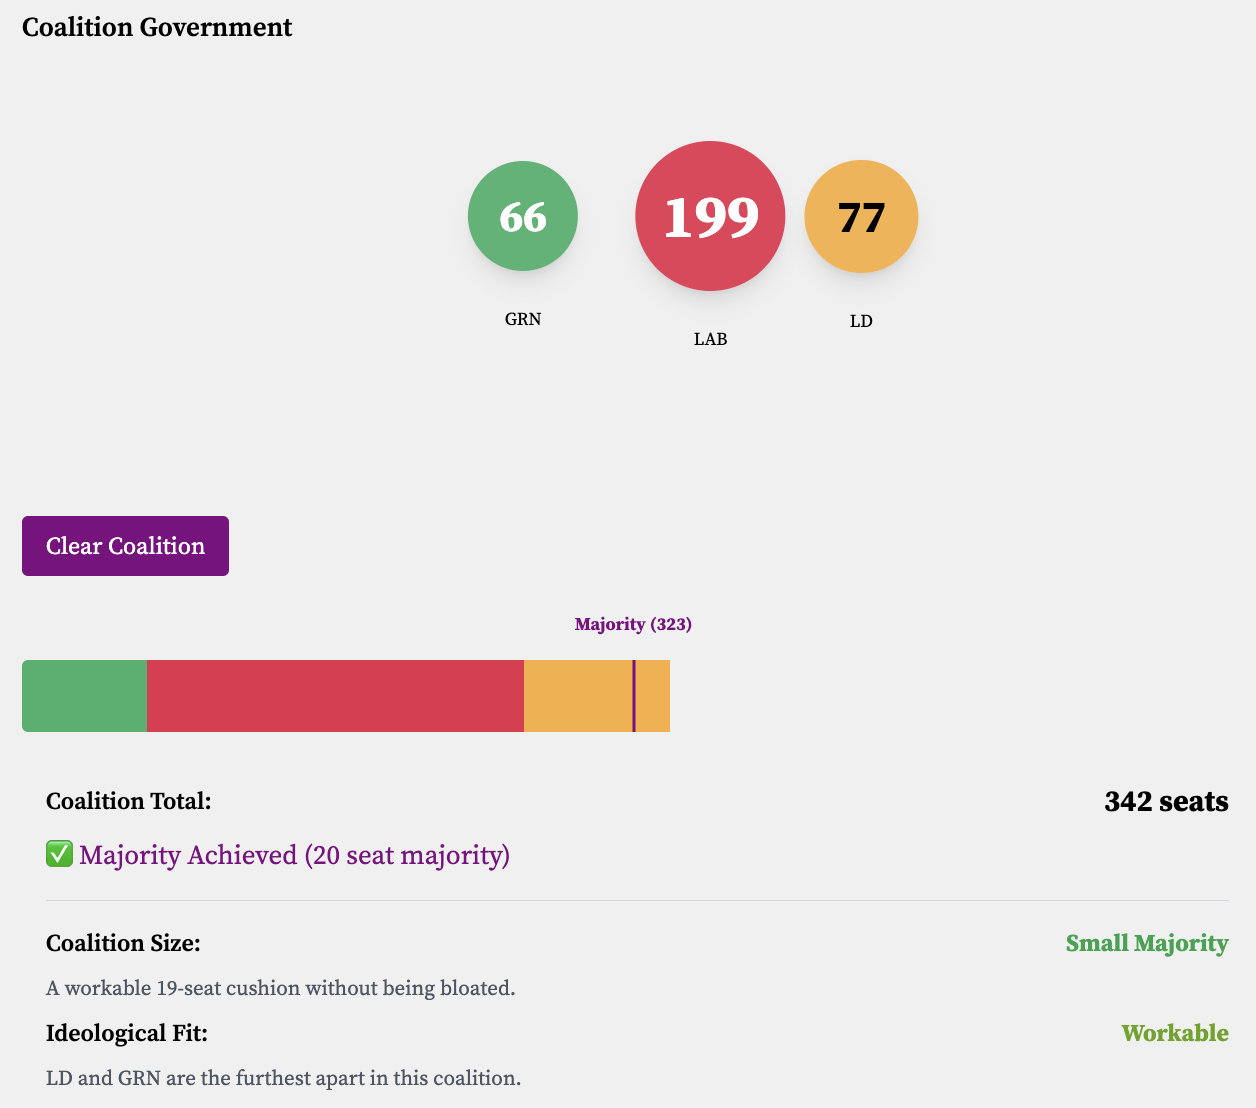
Coalitions formation under AV and a German style Mixed Member System using the today’s polling average (9/10/26).
The usual caveat
This is a projection, not a prediction. We’ve tried to account some real-world, but correctly estimating tactical behaviour and local factors across 650 seats lots of competing parties is impossible to do perfectly. We will keep amending the model to improve the methodology as more data becomes available and as events take place which could add even more crucual local factors. The model is based on historic trends and a series of mathematical formulas, trends may not continue or they may strengthen.As with all our projections. Please don’t bet on any of this.